Error detection and analysis in the study of the practice of land surveying
(The case of the chora of Pharos, island of Hvar, Croatia)
1. Introduction
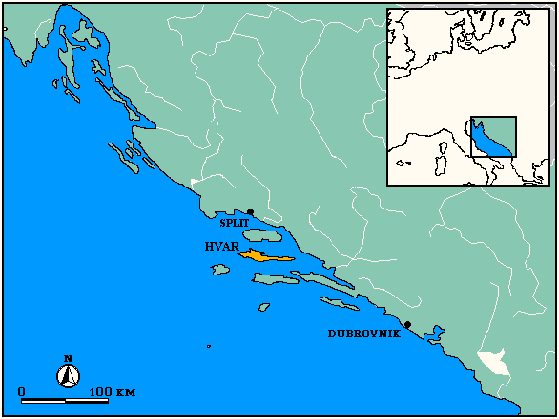
All measurement is subject to both accidental and systematic error, and that goes also for geometry applied as land surveying, ancient and modern. Modern surveying instruments should, however, provide for precision needed to detect deflections of the layout of ancient regular land divisions from their theoretical grid design. We can justifiably assume that there is a wealth of information in systematic errors thus identified, concerning the practice of ancient land surveying. Here we would like to present some preliminary results of such work on the chora of the Greek colony of Pharos on the island of Hvar (figure 1).
Figure 1 Island of Hvar in the central Dalmacia
2. The Pharos case
The regular land division (figure 2) in the chora of the Parian colony of Pharos (founded 384 B.C.) has been analyzed in terms of its modular structure (Zaninovic 1980, Slapšak-Kirigin 1985) and of the unit of measurement (Stancic-Slapšak 1987). In the 80s, based on the study of the surviving communication network and landscape structures as documented on the 1:5000 Ordnance Survey maps (and on aerial photographs), and on field survey (relative importance of terracing on the limits of modular units), the module of 5x1 stadia was identified there with overwhelming certainty.
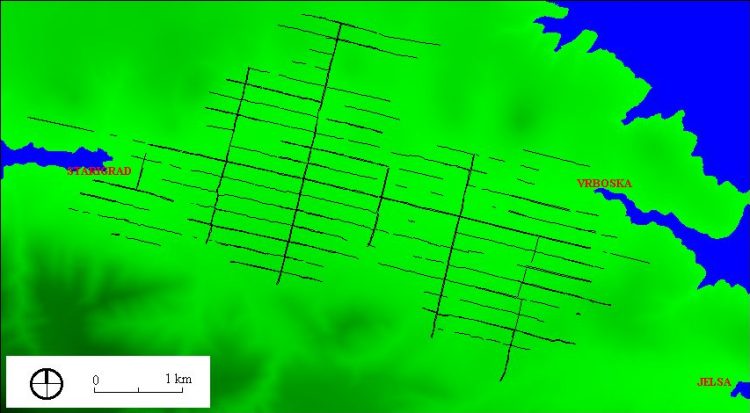
Figure 2 Ancient land division in the chora of Pharos
Statistical analysis of a sample of 100 distances taken between limits of modular units on the 1:5000 OS map (min. 1 unit, max. 15 units, aver. 4,84 units) has shown differential distribution of values on the two axes (N-S, E-W), and this was explained, given the rectangular form of the modular units, by the existence of limites extra clusi (total number of E-W limites 5 times the number of N-S limites). A calculation of the standard deviation at different values of limites (between 6 and 15 feet) produced the figure of 10 feet as the most probable, provided all limites are equal in width. Therefrom, the foot unit of the limitatio could be identified at 302,16mm, which is comparable to the value proposed by Broneer for the 4th c. B.C. reconstructions of the stadiums in Isthmia and Epidaurus.
Parallely, inconsistencies were observed in the layout of the limitatio, notably in the orientation of its major axes. While this called for caution as to the results of our previous analysis (our measurements, while accounting fully for random error, did not necessarily take possible systematic distortion into consideration), it also raised hopes that we may gain some insight into the procedures and technical problems of the ancient surveyors here. In 1995, we elaborated, also in view of the goals promoted by the COST G2 PASTA network, a program of further metrological investigation on the Pharos land division.
3. Database
Our main advantage now, compared to our work in the 80s, is easy access to computer graphics, CAD and GIS programs. Our first step was to produce a high resolution digital model of the study area (data were retrieved from the 1:5000 OS map, which in turn is based on the 1970s aerial photogrammetry of the island). All features mapped which coincide with the limites (communications, walls, landplot limits) were digitized and some of the major inner divisions were added (at full and half stadia). From these digital layers, all numeric data needed for the analysis could be retrieved.
Analytical potential of unconnected data, such as could be retrieved from OS maps, is minimal. We therefore decided to build a georelational data model in such away that each side of the modular unit is represented by one line and described by its attributes. Only those modular units which could be defined by all four sides were chosen. Total number of modular units in the transformed model is 29, covering 4.9 km2, which is 35% only of the total surface under regular land division. While the surface is not large, the area is compact and covers much of the central part of the plain (figure 3).
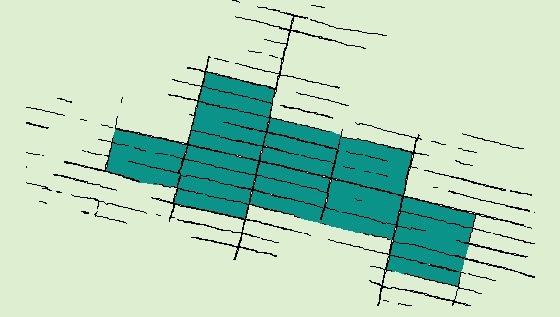
Figure 3 The area under study
We use ARC/INFO GIS to represent selected geographical features. The most appropriate is the vector data model, which is the best suited for accurately depicting the location and shape of the lines and areas. Later on we use also IDRISI's raster data model to present DEM and surface analyses.
Geographic features in GIS are represented by locational and descriptive data. They are linked and stored in coverage. Coverage have associated attribute information stored in tables. Each row of the table contains one entity, which is described by attributes. When the topology is built, the software automatically generates standard attributes of the lines:
To these, we added further attributes (figure 4, 5, 6) needed for our analysis:
|
initial and terminal points of the lines |
|
grid bearing of horizontal and vertical lines |
|
position of the line within the grid |
|
orientation of the lines; horizontal (2), vertical (1) |
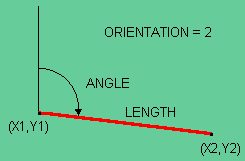
Figure 4 Attributes of the horizontal line
We calculated the ANGLE (grid bearing) attribute of lines from their initial and terminal points Y1, X1, Y2, X2. The values calculated are between 12.11° and 14.52° for the horizontal and between 101.95° and 104.08° for the vertical lines.
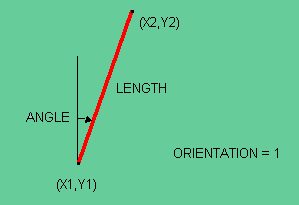
Figure 5 Attributes of the vertical line
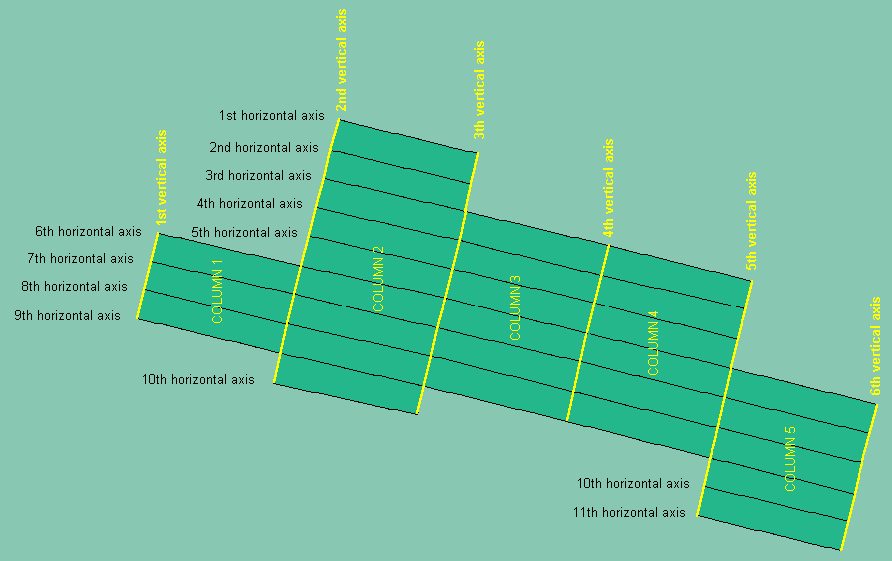
Figure 6 Attributes COLUMN and ROW (horizontal axis) define the position of the line within the grid
The final lines attribute table includes 74 entities which represent sides (border lines) of the modular units of the Greek regular land division (5x1 stadium). Each entity is described by 15 attributes.
4. Omphalos
We will assume that the limitatio of the 4th c. B.C. Greek colony of Pharos was conceived according to a gromatic doctrine comparable to that known to us from later Latin authors, with umbilicus as the starting point of the measurement. Of the three categories of operations involved in laying out a rectangular grid, defining perpendicular lines from a point, which is the initial operation of the measurement from umbilicus, is the most complex one and potentially subject to maximum error. While tracing a straight line is an operation which permits maximum precision by simple use of three surveying rods (and signals), and defining a perpendicular line permits aligning the instrument on a well defined straight line, the starting operation combines error of the instrument (groma), of operator and of four independent sights.
We can therefore formulate the hypothesis that, all things equal (e.g. in case of a land division in a horizontal plain), and if the surveyors depended on their instruments solely (and did not exercise additional geometric verifications and rectifications of the layout), the umbilicus of the limitatio will be that crossing of the horizontal and vertical axes of the limitatio which displays maximum simultaneous deflection on both axes.
In order to detect such deflections, we need to analyze grid bearings of both horizontal and vertical lines of all modular units.
Grid bearings of the horizontal lines within single columns of our limitatio represent a relatively homogenous population. Variation between columns is significant, however, with a notable difference between columns 2 and 3. What we have here are actually two homogenous populations of angles, one in columns 1 and 2 (102.76 ± 0.24 ° ), and the other in columns 3, 4 and 5 (103.72 ± 0,20 ° ). The arithmetic mean of the difference between the two populations, divided by the vertical axis 3, is 0.96° .
Grid bearings of the vertical lines display more variability, all axes, however, are deflected on the 6th horizontal axis (observable only on vertical axes 2, 3, 4 and 5, which actually cross the 6th horizontal axis; this is not the case with 1st and 6th vertical axes, they are very poorly defined above the 6th horizontal axis, so they were not taken into consideration here).
The two observations combined point, in view of the hypothesis above, to the crossing of the 3rd vertical and 6th horizontal axis as the umbilicus of the limitatio of the chora of Pharos.
The hypothesis can be verified by considering independent sets of observations regarding the viability of the point in question as the umbilicus of the limitatio, in terms of the morphology of the landscape and the technical aspects of ancient land surveying.
On the 6th horizontal axis, the point is located on the elevated ground near the center of the area under regular land division (figure 7). Visual control of much of the W part of the axis is hindered by the peak of this elevation some 300 m to the W; however, the extreme end of the axis to the W can be viewed from this point. The same goes for the E part of the axis, where parts of the lower ground are hidden by the edge of the central elevation at about the same distance (300 m), while the raising ground to the E can be viewed clearly.
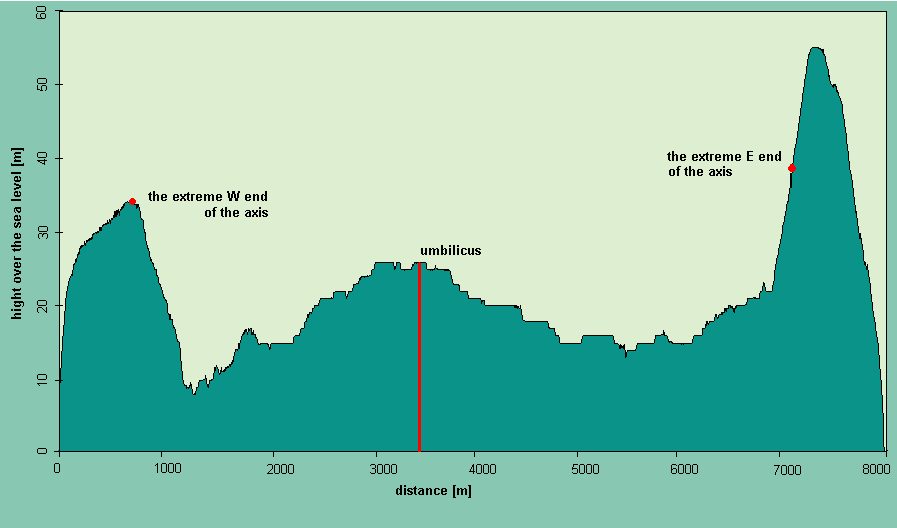
Figure 7 Vertical profile over the main horizontal axis
On the 3rd vertical axis, the point is located on the edge of a large depression (figure 8), which permits full control of both the raising ground to the S and of both sides of the depression, up to the pass on the hill range which separates a small distinctive part of the land division from the main area in the plain.
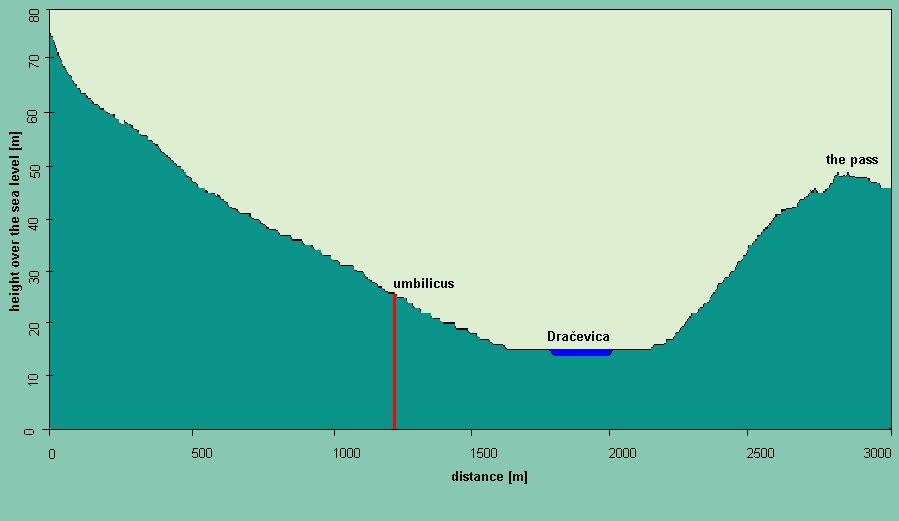
Figure 8 Vertical profile over the main vertical axis
The exact position of the axis seems to be defined by the location of the pass and of the carstic source of Dracevica (figure 9) at the bottom of the depression, which is the main stable water source in the Western part of the plain.
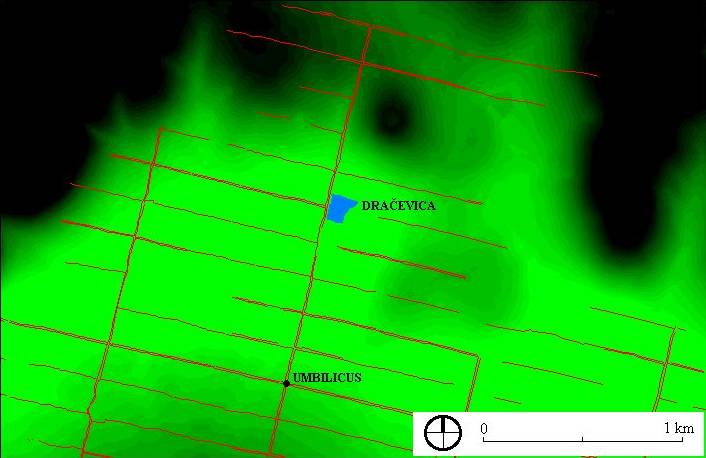
Figure 9 Position of the main vertical axis in relation to the morphology
As the starting point of mesuration, this point would permit visual control (figure 10) of the whole of the vertical axis (except its extreme part to the N beyond the line of the hills) and of the extreme parts of its horizontal axis. Considering the overall morphology of the area under regular land division, the crossing of the 6th horizontal and 3rd vertical axis is a good choice for umbilicus in terms of any land surveying, ancient or modern.
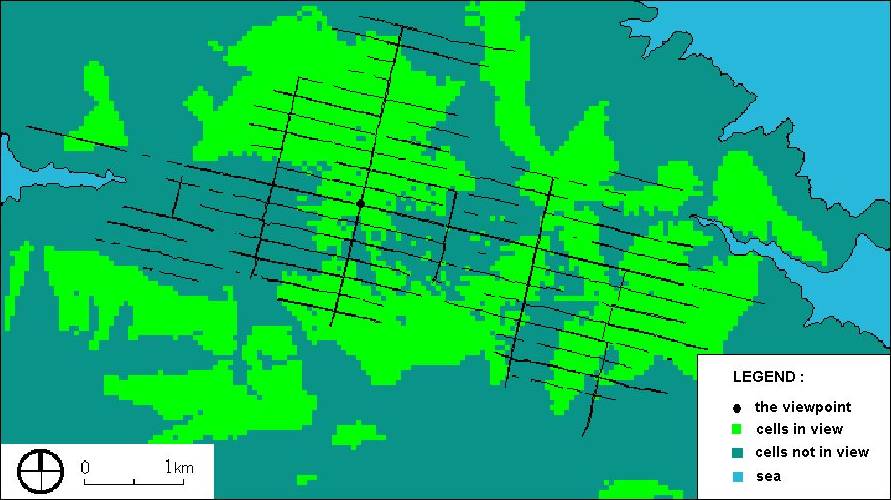
Figure 10 Visibility from the umbilicus
Our initial hypothesis about the identification of the location of the umbilicus is therefore strengthened by these observations. We will further consider crossing of the axes as the umbilicus of the regular land division of the chora of the Greek colony of Pharos and the 6th horizontal and 3rd vertical axis as the main horizontal and the main vertical axis.
5. Surveying procedure
The enhanced model of the deformations displays clearly the combination of systematic and accidental components in the transformation of the regular grid. The main horizontal axis is deflected at one point only, namely in umbilicus, and all horizontal axes are equally deflected on the main vertical axis. All vertical axes are deflected on the main horizontal axis, variability of their grid bearings within sections of columns below and above the main horizontal axis is low compared to this deflection, variability of vertical grid bearings between sections is accidental.
These observations permit us to propose a reconstruction of the surveying procedure for the regular land division of the chora of Pharos.
Umbilicus was identified based on the observation of the deflection of a horizontal and a vertical axis at the same point, which is explainable by the fact that all four directions were defined from this point, as should be the case with the starting point of the limitatio. Deflections result from the problems of defining exact right angles from one point by the sole use of groma as surveying instrument, and of defining positions at long distances with sufficient precision (signals).
The main axes were then laid in field (figure 11). The precision and the absence of any deflections on the main axes between the starting point of the mesuration and the extreme points of the axes visible from the umbilicus would witness for the use of signals at the extremities of the axes. The sole use of surveying rods would inevitably produce cumulative error and gradual deflection of the line of the axis at distances involved (up to 4 km). We should therefore assume that in the first step, points on the extreme ends of the axes, visible from the umbilicus were defined by the use of groma, and signals were established on them. Other signals may have been established along the axes from the umbilicus, most probably on the horizontal axis at both edges of the elevated ground some 300 m to the E and W of the groma. These signals would permit easy alignment in-between, with the point of the umbilicus as the second signal, and would then control the whole stretch of the axes to the signals at the extremities of the axes. On the vertical axis the point of the umbilicus could serve as the second signal for the total length of the stretches of the axes to the signals at the N and S points initially defined at their extremities. To the N however, the axis would then have to be transferred from this extreme point into the depression behind the hill range. This part of the regular land division being outside our study area, we will not consider it further here.

Figure 11 Reconstruction of the surveying procedure, laying out of the main axes from umbilicus (deflections enhanced)
Parallel to laying out of the main horizontal axis, or after having completed this operation, lines on the axis was measured (figure 12) and marked for 5 stadia lengths of the modular units of land plots and for limites extra clusi in-between. At the center of each spacing for a vertical limes, positions for the groma were marked.
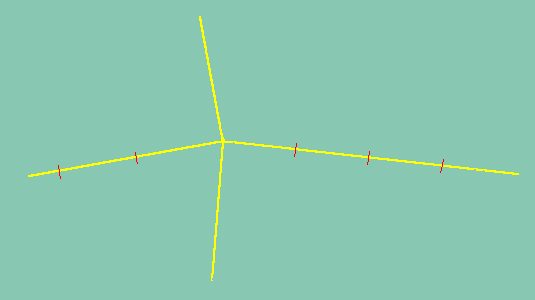
Figure 12 Reconstruction of the surveying procedure, defining of the length of the modular units on the main horizontal axis
Vertical limites were laid out from these points (figure 13) in separate and independent operations by groma aligned on the axis. Perpendicular lines thus defined were marked at extreme points visible from the groma and signals were established there to help laying out of straight lines between the two points. In most cases, no other signal points would be needed in-between.
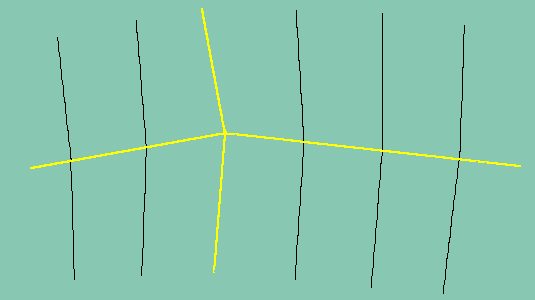
Figure 13 Reconstruction of the surveying procedure, surveying of the vertical axes from the points on the main horizontal axis
Vertical limites would then me measured and marked for 1 stadium widths (figure 14) of the modular units and for limites extra clusi in-between.
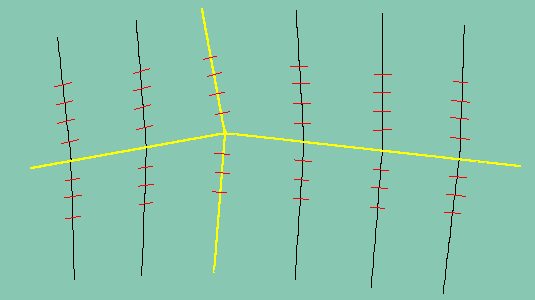
Figure 14 Reconstruction of the surveying procedure, defining the widths of the modular units on the vertical axes
The lines for horizontal limites parallel to the main axis were laid down by simply connecting by straight lines (figure 15) the points thus marked on the vertical limites. (There may have been problems in some cases where visual contact between the points on the vertical limites to be connected was not possible because of the morphology of the terrain, but we have not checked such cases for possible deflections and deformations along the lines.) Mathematically, horizontal limites by columns are defined as parallels to the respective sections of the main horizontal axis. Possible error in the alignment of the main horizontal axis is thus reproduced on all horizontal lines in the column. This can be clearly observed along the 3rd column where all horizontal lines are deflected. The horizontal lines, with the exception of the main horizontal axis, were therefore neither surveyed by groma nor measured for exact length of the modular units.
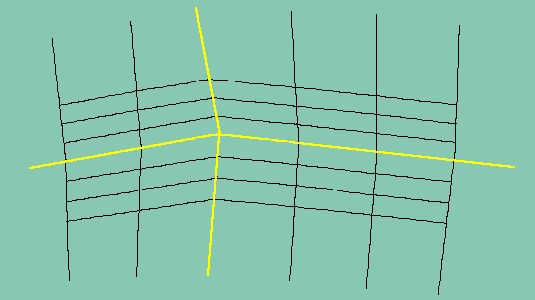
Figure 15 Reconstruction of the surveying procedure, the formations of the modular grid due to surveying procedure
6. Conclusion.
The results presented here are only preliminary and will demand further refinement and control. They do permit, however, to address more general questions of the potential of metrological study of ancient land divisions and of the importance of precision measurements in field as part of this study. Modern technology, and most notably the developments in GPS technology, have provided valuable tools for such work. The Department of Archaeology of the University of Ljubljana has been lucky to have the support and collaboration of the Geodesy Institute of Slovenia (ing. Andrej Bilc) in this first attempt within our project at making good use of the tool in the archaeological investigation of ancient landscapes, and there is readiness from both sides to continue this work. Furthermore, we hope to be able to expand and develop metrological studies in ancient landscape studies, and we would welcome collaboration with other teams on the problems involved.
* the paper is summary of the preliminary results of the graduate thesis by Jurij Mlinar at the university of Ljubljana, under joint direction of Bozidar Slapšak and Zoran Stancic
Literature:
Slapšak, B. and Kirigin, B., Starigradsko polje na otoku Hvaru, Arheološki pregled, 1985
Stancic, Z. and Slapšak, B., Dolocitev osnovne merske enote pri anticni delitvi zemljišc, FAGG, 1978
Zaninovic, M., Greek Land Division at Pharos, Archaeologia Iugoslavica 20-21, 1980